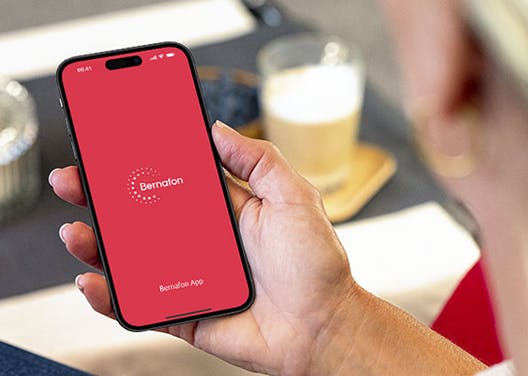
Hear your day, your way.
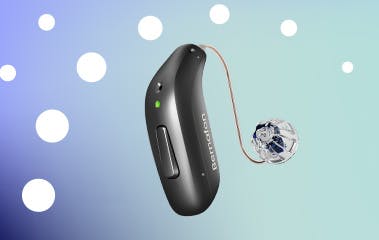
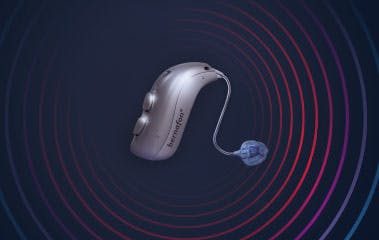
It’s your hearing. Let’s make it work for you. Find the Bernafon Encanta hearing aid that matches your hearing needs. And enjoy the moments that make life worth hearing.
It’s your hearing. Let’s make it work for you. Find the Bernafon Encanta hearing aid that matches your hearing needs. And enjoy the moments that make life worth hearing.